Russia’s ongoing naval blockade of Ukraine has the potential to be the single most disruptive event for food prices since the 2008 global food price crisis.
This assessment was issued to clients of Dragonfly’s Security Intelligence & Analysis Service (SIAS) on 15 June 2022.
Our analysis suggests that prices are now rising more quickly than three months ago in 157 (or 89%) of the 176 countries where up-to-date CPI data is available. And with Russia’s Black Sea blockade leaving millions of tonnes of wheat and grain stranded, further pressure on the global cost and availability of key food staples is highly likely in the coming months.
In April we collected data on a range of indicators to measure which countries are most likely to be affected by such food price volatility, as well as where this is likely to have knock-on effects for second- and third-order risks such as unrest. In light of Russia’s new blockade of the Black Sea, we have updated this data.
Inflation was on the rise prior to the Ukraine crisis, largely due to the Covid-19-induced supply chain crisis. But the war is also clearly feeding into inflationary pressure across the globe: 99% of countries with available data are now experiencing increases in the cost of living (compared with just over 90% in April). And in those countries where the cost of living is increasing, the pace of such price increases has accelerated in 89% of these (that is, prices are now rising more quickly than before). Countries that are being particularly affected (in order of most impacted) include Zimbabwe, Argentina, Sri Lanka, Turkey, Ghana, Sudan, Ethiopia, Rwanda, Moldova and Latvia.
The nature of global commodity trading, including of food, means that it is not simply countries that have previously relied on imports from Ukraine and Russia that will be most affected by the conflict, or the ongoing blockade. This is because those countries can, in theory, seek alternate sources of wheat or maize from elsewhere on the global marketplace. This means that shoring up supply of foodstuffs will often come down to – among other things such as those who have purchased futures, and diplomatic relations – which countries are prepared to, or able to, pay the inflated market rates.
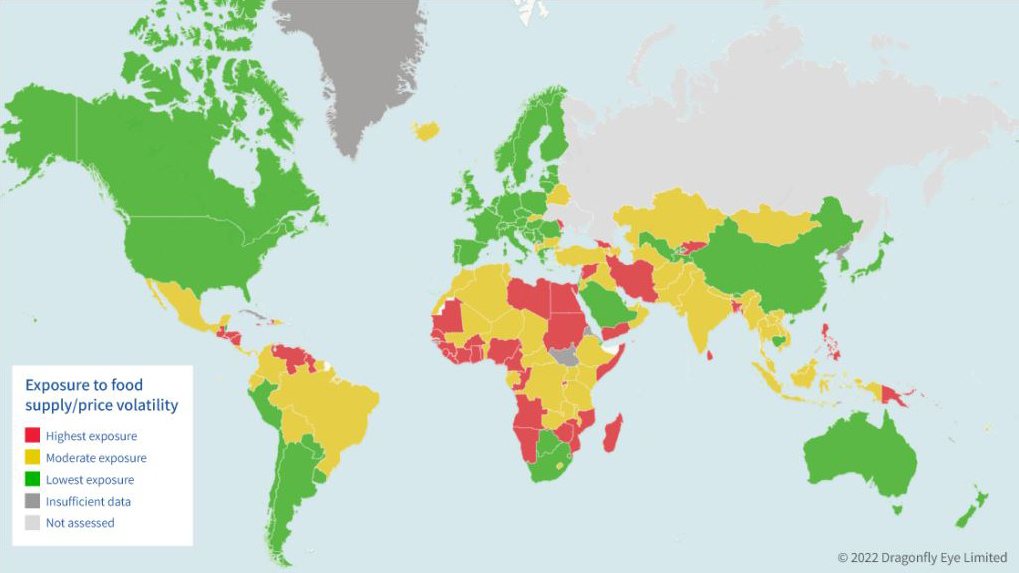
Our methodology for assessing where is most vulnerable to food supply/price volatility therefore took into account several factors. First is the extent to which a country was already experiencing rising food prices or food shortages (looking at indicators such as consumer price index and existing pervasiveness of undernourishment). Second is the country’s potential exposure to current food price volatility due to the Ukraine conflict (indicators such as commodity production and consumption, and volume of exports from Ukraine and/or Russia). Finally was the extent to which a government is able to mitigate the effects of volatility (indicators such as foreign currency reserves, governance and debt).
These assessments are intended to be forward looking. Since our initial report in April, the situation has worsened in Egypt (which moved from moderate exposure to highest exposure), Bolivia (lowest to moderate) and Laos (lowest to moderate). It has improved in Malawi (which moved from highest to moderate exposure).
Clients have also asked us about where food volatility may have knock-on effects, such as unrest or instability. In order to assess this at scale, we have overlaid our exposure to food supply/price volatility scores with our civil unrest risk ratings. This is designed to give us a view of the countries where there is a crossover between a high exposure to food volatility and underlying high unrest risks: these are the countries that we assess are the most vulnerable to hardship protests or unrest related to food price hikes or shortages.
Since April, we assess that the risk of unrest stemming from food volatility has decreased in Gabon (which moved from moderate to low risk), as well as Cote d’Ivoire, Niger, Senegal and Sierra Leone (all moved from high to moderate). In all of these cases, this is largely because our assessment of the broader unrest risk has also fallen. The risk has risen in Cameroon, Chad, Colombia and Jamaica (all of which moved from moderate to high).
Methodology note
The datasets we used for this exercise were inevitably patchy and incomplete. Where possible, when data has not been available for a particular country, we have tried to lean on other similar datasets or our own analysis and assessments. Unfortunately, this was not possible for all countries. Those for which we were unable to produce scores due to problems with data availability are marked on the maps as ‘insufficient data’.
A fuller version of this report with interactive maps is available to subscribers to our Security Intelligence and Analysis Service (SIAS). Please get in touch if you’d like to hear more about SIAS and how we support corporate security teams around the world.